 NLJUG – Nederlandse Java User Group NLJUG – de Nederlandse Java User Group – is opgericht in 2003. De NLJUG verenigt software ontwikkelaars, architecten, ICT managers, studenten, new media developers en haar businesspartners met algemene interesse in alle aspecten van Java Technology.

It seems like J-Fall 2026 is still far away, but the call for papers is …
Read More »
June 2026
NLJUG SPEAKER ACADEMY 2026
It seems like J-Fall 2026 is still far away, but the call for papers is open and we are looking for …
May 2026
J-Spring 2026 The International Java Conference by NLJUG June 4th
In two weeks, J-Spring is finally here, and the entire team is really looking forward to it! The pre…
March 2026
Oracle brengt Java 26 uit
De nieuwe release bevat 10 voorstellen voor verbeteringen aan de JDK (JDK Enhancement Proposals) die…
March 2026
Java 26 (JDK 26) introduces several important improvements to the Java platform
Java 26 (JDK 26) introduces several important improvements to the Java platform including HTTP/3 sup…
February 2026
VibeCoding – the buzzword in our community in 2026. It’s time to dive in!
We’re proud to announce that during the first edition of MLCon Amsterdam (April 20–24), we will also…


-
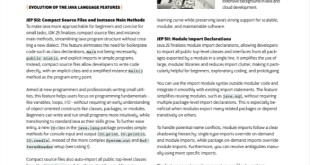
An Exploration of Cutting-Edge Updates – Ana-Maria Mihalceanu
Lees hier het artikel “An Exploration of Cutting-Edge Updates” van Ana-Maria Mihalceanu.
Read More » -

Java Magazine 4
-

Java Magazine 3 is uit
-

JAVA MAGAZINE 2 – 2025
-
JAVA MAGAZINE 1 – 2025


[widgets_on_pages id="Home widgets"]
Java Articles by Foojay.io
June, 2026
-
12 June
Codename One: On-Device Debugging And JUnit 5
Author: Shai Almog Original post on Foojay: Read More Table of Contents On-device debugging that treats Java as Java What it looks like How the pieces fit together Tutorial: IntelliJ + iOS Tutorial: IntelliJ + Android When to use it (and when not to) JUnit 5 against the simulator A minimal test A couple more common cases Wrapping up This …
Read More » -
11 June
BoxLang 1.14.0 : Introducing Inner Classes
Author: Cristobal Escobar Original post on Foojay: Read More Table of Contents The Two FlavorsTemplate Classes Hoisting Multiple Classes in One Script Properties, Constructors, and Static Members Inheritance Java Interoperability Imports Are Shared Template Classes in .bxm Files Inner Classes Hoisting in Inner Classes Multiple and Nested Inner Classes Inheritance Between Inner Classes Accessing Outer Class Statics External Access via …
Read More » -
10 June
Building an AI-Powered Operations Assistant with Spring AI and MongoDB Atlas — Part 2: Conversational Memory
Author: Matteo Rossi Original post on Foojay: Read More Table of Contents The Problem with Stateless ChatWhat We Are BuildingTwo Different Kinds of MemoryMix & MatchShort-Term Memory: Keeping the Conversation CoherentLong-Term Memory: Carrying Knowledge Across SessionsMemory Consolidation: From Conversation to Durable FactThe Advisor Chain and Why Order MattersThe Atlas Index for MemoriesTrying It OutConclusion and What’s Next This is the …
Read More » -
10 June
Why Spring Teams Don’t Need a Second Runtime for AI Agents
Author: Sekka Original post on Foojay: Read More Table of Contents What agents actually need in productionWhat Spring already gives youBUILD: Create agent teamsGOVERN: Budget, approvals, permissions, checkpointsOPERATE: Observe, recover and run safely Retry that understands cost Operational sovereignty One stack, one runtimeGetting started A JVM-native runtime for building, governing and operating AI agents on existing Spring infrastructure. Every time …
Read More » -
10 June
Your TLS Stack Is Lying to You About Zero-Copy
Author: Arkadiusz Przychocki Original post on Foojay: Read More Table of Contents The “No Waste Compute” ConstraintThe Impedance Mismatch in Memory OwnershipThe Netty QuestionExplicit State and FFMWhat the Exploratory Benchmarks ProveThe GC Layer and the True Cost of AbstractionsWhere SSLEngine Still WinsWhat I Changed, and What I Gave Up The “No Waste Compute” Constraint When I started designing the Exeris …
Read More » -
9 June
JC-AI Newsletter #16
Author: Miro Wengner Original post on Foojay: Read More Over the past two weeks, the field of artificial intelligence has continued its remarkable pace of advancement. As AI becomes increasingly woven into the fabric of daily life, shaping how we work, communicate, and make decisions, it is both timely and valuable to step back and understand the broader trajectory of …
Read More » -
9 June
Introduction to CQRS using MongoDB
Author: Otavio Santana Original post on Foojay: Read More Table of Contents PrerequisitesStep 1: Create the entitiesStep 2: Creating CommandStep 3: Create QueryConclusion In enterprise environments, projects often begin with a simple structure: one model, one service, and one document, using a single class and data transfer object for both read and write operations. While this unified approach works at …
Read More » -
9 June
Lottie4J Meets LottieFiles: A Conversation with Naail Abdul Rahman
Author: Frank Delporte Original post on Foojay: Read More Table of Contents What we talked aboutLottie: from Bodymovin to everywheredotLottie: the format worth paying attention toWhat this means for Lottie4JLinks from the videoConclusion Lottie animations run on Android, iOS, and the web. Getting them working on the JVM is a different story. Lottie4J started as a question: can JavaFX render …
Read More » -
8 June
Metal Default, A New Build Cloud, And A New Format
Author: Shai Almog Original post on Foojay: Read More Table of Contents Metal is the default on iOSThe new Build Cloud console is now the default linkUpcoming attractionsWrapping up This week’s release post looks different on purpose. The Friday omnibus has been getting longer and longer, and that has been working against us in two ways. SEO ignores 5,000 word …
Read More » -
5 June
“Agentic” Was Everywhere at Money20/20 Amsterdam — Once I Started Looking
Author: Geertjan Wielenga Original post on Foojay: Read More Table of Contents Core banking, reimagined as “AI-native”Payments and money movementLending, credit, and collectionsRisk, fraud, and complianceBuild-your-own-agent platforms and toolingData and infrastructure underneath it allContent, language, and trustServices and talentConclusions I walked the floor at Money20/20 in Amsterdam with a simple little mission: count the first ten vendor booths using “AI,” …
Read More »